Year
2026
Duration
6 weeks
Project
Information Design - AffectVis
Brief
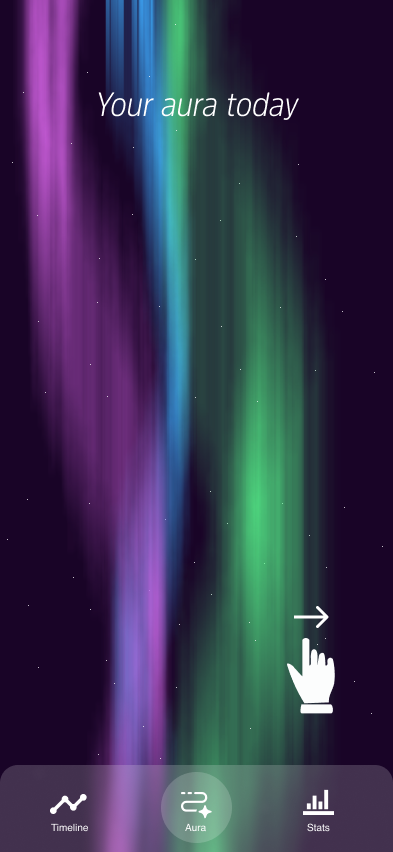
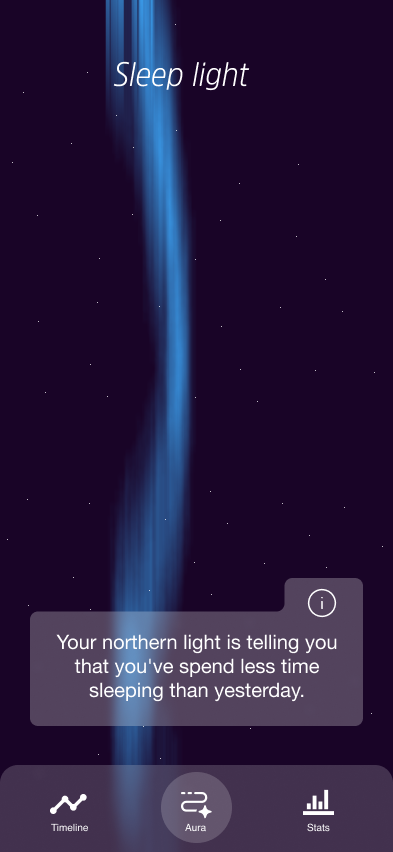
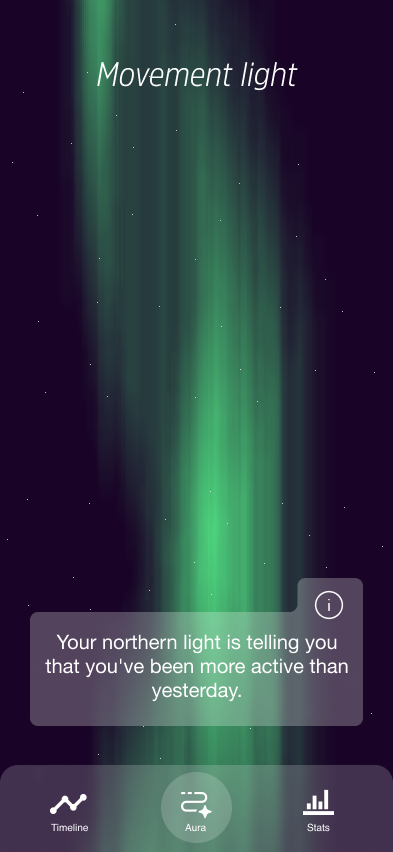
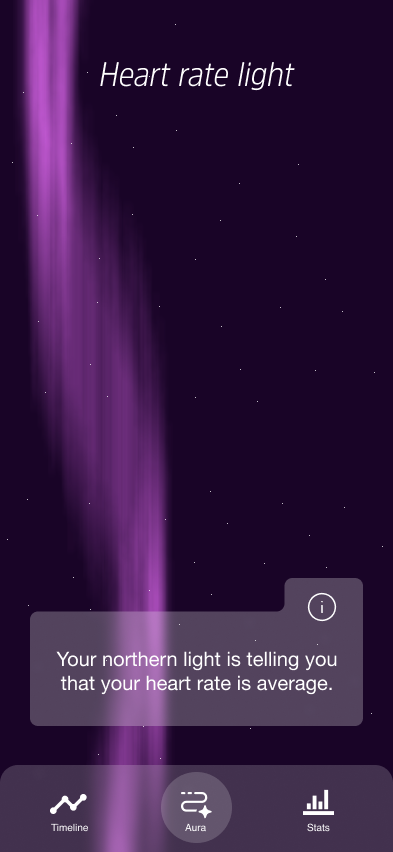
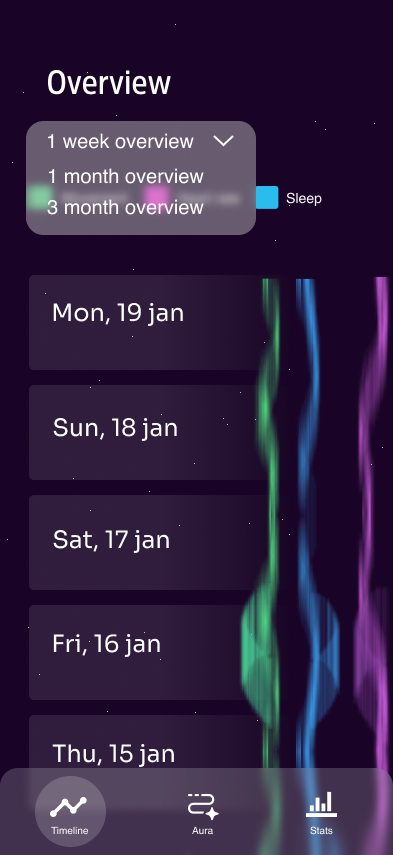
For this project, Bin Yu from Polar challenged us to rethink how personal health data could be visualized. Using data collected by the Polar Loop, such as sleep patterns and daily activity, we explored new ways to transform raw metrics into clear, engaging, and meaningful visual experiences. The goal was to create a visualization that not only communicated health insights effectively but also encouraged users to better understand and reflect on their own wellbeing.
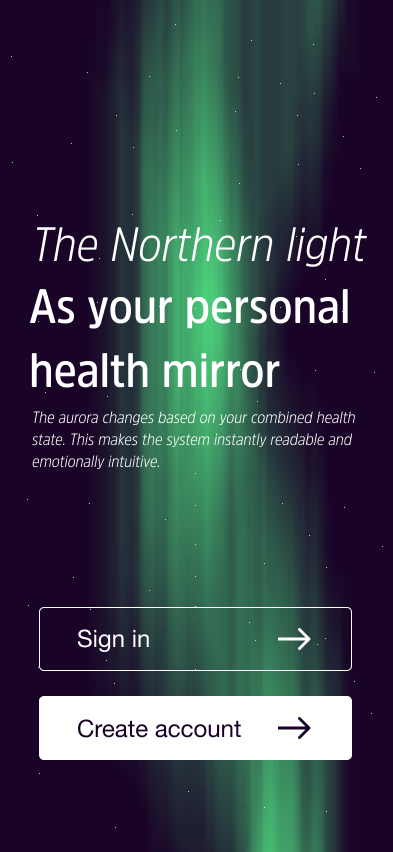
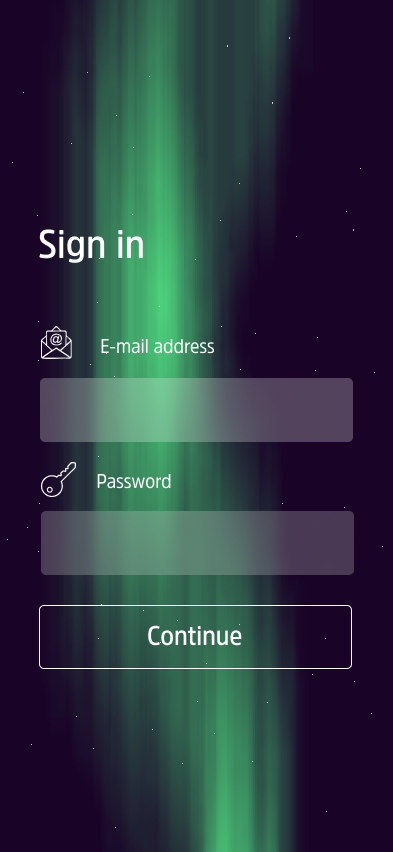
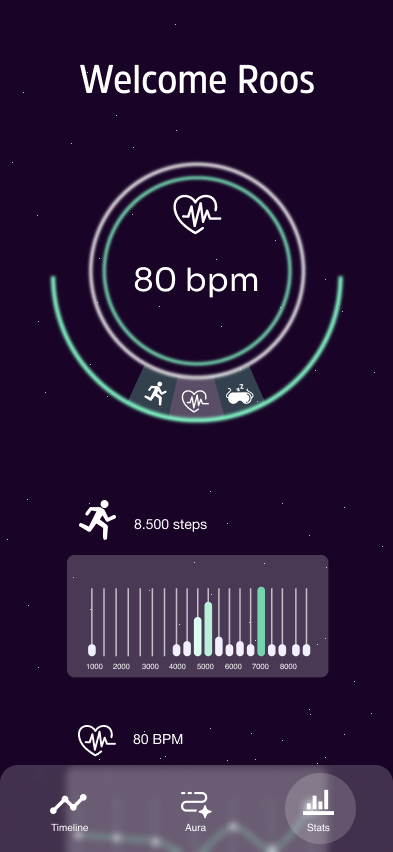
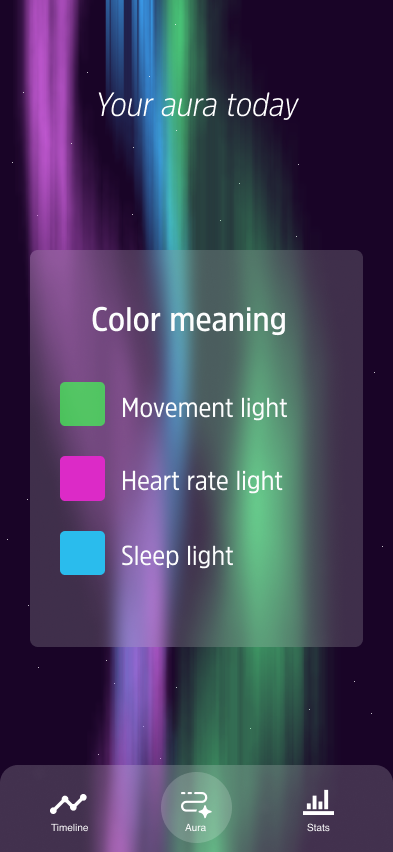
Final screens